
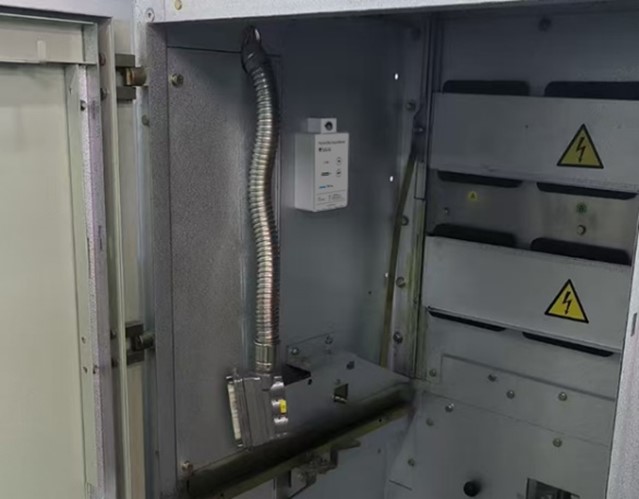
Partial Discharge Sensor Installation Guide
This article introduces a three-in-one partial discharge (PD) sensor
Partial discharge (PD) serves as a critical indicator of potential defects within a transformer’s insulation system. Accurately identifying the type of partial discharge is central to preventing catastrophic failures and ensuring equipment reliability. This guide demonstrates how to perform a precise diagnosis by analyzing a partial-discharge diagram amid complex signals.
There are four steps for transformer PD diagnosis:
The fundamental cause of internal air gap partial discharge is the presence of air gaps or voids within the insulating material that are not in contact with the electrodes. The dielectric constant of such air gaps is significantly lower than that of the surrounding insulating material; under the influence of an electric field, the electric field strength inside the air gap becomes distorted and far exceeds that of the external field. When this internal field strength reaches the breakdown strength of the air gap, it triggers partial discharge, resulting in a symmetrical partial discharge pattern.
The partial discharge diagram on the left is a Phase-Resolved Partial Discharge (PRPD) pattern; the horizontal axis represents the voltage phase angle (0°–360°), and the vertical axis represents the discharge charge quantity (pC).
The PD pattern exhibits a high degree of symmetry between the positive and negative half-cycles.
-. Symmetrical Phase Distribution: The distribution locations and pulse densities of the discharge pulses are essentially identical in both the positive half-cycle (0°–180°) and the negative half-cycle (180°–360°) of the voltage; furthermore, the pulses tend to cluster within the phase intervals immediately preceding the voltage peaks.
-. Random Pulse Characteristics: There is a certain degree of randomness regarding the amplitude (charge quantity) and specific phase position of individual discharge pulses; there are no fixed pulse amplitudes or specific phase points.
-. High Pulse Clarity: At the partial discharge inception voltage, the discharge pulses are clearly discernible, with no obvious pulse superposition or blurring phenomena.
By analyzing the relationship curve between discharge amplitude (q) and applied voltage (V), one can further distinguish the quantitative characteristics of the air gaps, thereby enabling a precise diagnosis of the partial discharge.
-. Figure A Single Air Gap: When only a single air gap exists within the insulation, once the voltage reaches the inception voltage (Vi), the discharge magnitude instantly jumps to a fixed value; subsequently, even if the voltage continues to rise, the discharge magnitude remains constant. When the voltage drops to the extinction voltage (Ve), the discharge ceases.
-. Figure B Multiple Air Gaps: If multiple air gaps exist within the insulation, once the voltage reaches the inception voltage (Vi), the discharge magnitude initially jumps to a certain value. As the voltage continues to rise, the discharge magnitude continues to increase gradually—this occurs because different air gaps possess different inception voltages, and as the voltage increases, more air gaps successively begin to participate in the discharge process.
The root cause of partial discharge along conductive interfaces (asymmetrical type) is electric field distortion at the interface. Typical scenarios include: cavities at the interface between metallic or carbonaceous conductors and insulating media (e.g., at conductor edges or gaps within insulation wrapping layers); conductive impurities adhering to the insulation surface (e.g., dust, metal particles, or moist contaminants); and semi-conductive layers formed on the insulation surface due to aging or contamination. Conductive interfaces disrupt the uniform distribution of the electric field, causing the local electric field strength to far exceed the insulation’s dielectric withstand limit, thereby triggering surface partial discharge.
The figure on the left displays the Phase-Resolved Partial Discharge (PRPD) diagram for another typical class of defects. Its primary function is to identify discharge faults occurring along conductive interfaces, serving as a crucial basis for assessing the condition of the insulation system.
The horizontal axis represents the voltage phase angle (°), covering a full power-frequency cycle from 0° to 360°. The vertical axis represents the discharge magnitude (pC), reflecting the intensity of the discharge.
The specific characteristics are as follows:
Asymmetry: There are significant differences in both the magnitude and quantity of discharge pulses between the positive and negative half-cycles. This disparity can range from 3:1 to over 10:1, constituting the most critical identifying feature of this specific defect type.
Phase Distribution: The discharge pulses are concentrated within the phase intervals immediately preceding the voltage peaks—a phase position consistent with that of discharge occurring within internal gas voids (cavities) within the dielectric medium.
Pulse Distribution: In one half-cycle, the pulses appear dense and exhibit high magnitudes; conversely, in the other half-cycle, the pulses are noticeably sparse with lower magnitudes, or there may be virtually no discharge activity at all.
Diagnostic Clue: q-V Characteristic Analysis
By analyzing the discharge magnitude (q) versus applied voltage (V) curve, the characteristics of the fault can be further refined:
Figure A: Constant Amplitude. Once the voltage reaches the inception voltage (Vi), the discharge amplitude instantly jumps to a fixed value and remains unchanged as the voltage subsequently rises; discharge ceases when the voltage drops to the extinction voltage (Ve).
Figure B: Increasing Amplitude. Once the voltage reaches the inception voltage (Vi), the discharge amplitude initially jumps, and subsequently continues to increase slowly as the voltage rises.
Metal tips or sharp edges on high-voltage conductors or grounded components induce electric field concentrations—whether in air or oil—leading to the formation of corona discharge. However, distinct differences exist between corona discharge occurring in air and that occurring in oil.
As illustrated in the figure on the left (Corona in Air): Discharge pulses appear exclusively within a single half-cycle of the voltage waveform; the pulse amplitudes are essentially uniform and are distributed symmetrically around the voltage peak.
The specific characteristics are as follows:
-. Discharge activity occurs unilaterally—appearing only during either the positive or negative half-cycle—while the opposing half-cycle shows no discernible pulses.
-. The amplitudes of the pulses are nearly identical and do not vary as the applied voltage increases.
Diagnostic Clues: The appearance of discharge during the negative half-cycle indicates the presence of a sharp point on the high-voltage conductor; conversely, discharge during the positive half-cycle indicates a sharp point on a grounded component. The amplitude of the discharge pulses remains constant regardless of increasing voltage.
As illustrated in the figure on the left (Corona in Oil): Discharge activity occurs during both the positive and negative half-cycles; however, the amplitudes and distribution patterns are severely asymmetrical. One half-cycle features pulses of significantly high amplitude, while the opposing half-cycle presents pulses that are smaller in amplitude but much denser in occurrence.
Specific characteristics are as follows:
-. Discharge activity is present in both half-cycles, yet the morphological patterns of the pulses differ significantly.
-. The amplitudes of the large pulses increase in proportion to the rise in applied voltage—a fundamental distinction that differentiates corona discharge in oil from that in air.
Diagnostic Clues: The appearance of large-amplitude pulses during the positive half-cycle indicates the presence of a sharp point on the high-voltage conductor; conversely, large-amplitude pulses during the negative half-cycle indicate a sharp point on a grounded component. The amplitudes of these large pulses increase as the applied voltage rises.
The partial discharge diagram associated with floating potentials and poor contacts can be broadly categorized into two typical types of discharge/interference patterns: “floating potentials” and “contact noise.”
As illustrated in the diagram on the left. Floating potentials typically arise from the presence of poorly grounded metal components (such as loose shielding layers) within the test circuit or the test specimen itself.
The characteristic features are as follows:
-. Pulses of equal amplitude appear in both the positive and negative half-cycles;
-. The phase position remains fixed or exhibits a stable drift; and the spacing between pulses decreases as the applied voltage increases.
Diagnostic Clues: The discharge amplitude does not vary with changes in voltage. Occasionally, the discharge may vanish abruptly once the voltage rises to a certain level.
Contact noise is primarily caused by poor metal-to-metal connections (such as switches or connectors) or contact issues involving semi-conductive layers within the test circuit or the test specimen.
As shown in the pattern on the left, the characteristic features of contact noise are evident: the discharge pulses are concentrated around the voltage zero-crossing points.
Diagnostic Clues: The signal amplitude typically increases slowly and in proportion to the applied voltage. Increasing the resolution of the detection circuit can serve to reduce the apparent amplitude of the signal.
The core diagnostic principle for this category of PD diagram is as follows: a key characteristic of interference signals is their independence from the test voltage; they may persist even under zero-voltage conditions. These sources of interference primarily include noise from thyristors and rectifiers, rotating machinery, radio signals, and switching power supplies or fluorescent lamps. Such interference can be effectively suppressed through shielding, filtering, or the selection of an appropriate detection frequency band.
Step 1: Observe the Pattern Morphology
Position & Symmetry: Evaluate the phase position of the pulses (e.g., preceding the peak or crossing the zero point) and the symmetry between the positive and negative half-cycles.
Step 2: Vary the Test Voltage
Analyze q-V Characteristics: Observe how the discharge magnitude responds to changes in voltage. Does it remain constant, increase gradually, or surge abruptly? This helps in determining the quantity and nature of the defects present.
Step 3: Maintain Voltage and Observe
Analyze q-t Characteristics: Continue observing the signal under constant voltage conditions. An increase or decrease in magnitude serves as a key clue for distinguishing between different material aging mechanisms.
Step 4: Eliminate Interference Artifacts
Zero-Voltage Check: Verify whether the signal disappears when the test voltage is removed. This constitutes the “golden rule” for distinguishing between internal signals and external interference.
Partial discharge patterns serve as the language of insulation condition. Accurate partial discharge diagnosis relies not only on systematic analytical methods but also on specialized PD monitoring equipment. Every instance of partial discharge monitoring acts as a successful early warning against potential faults, constituting a robust safeguard for the safe and reliable operation of power systems.

This article introduces a three-in-one partial discharge (PD) sensor

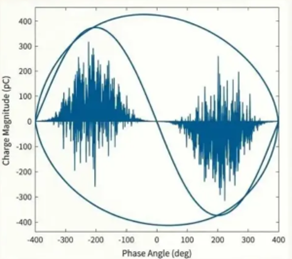
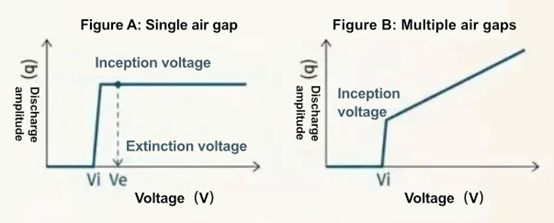
What is switchgear partial discharge? Partial discharge (PD) in

Which sensor is used to monitor partial discharge? The
